Aldera data report · 2024-25 edition
California Regional Center Spending Report
California's 21 Regional Centers approved $19.1 billion in services for people with developmental disabilities from July 2024 to June 2025, and spent $12.8 billion. We went through the state's own reports for every center to see where approved help went unused, who got less, and how long families waited for plans in their own language.
- 44%of translated IPPs came after the 45-day limit
- $6.3 billionapproved for services but never spent
- 3.5xthe spending per client at Westside as at Central Valley, at nearly equal rates
Key findings
-
Nearly half of translated plans came late.
Regional Centers have 45 days to translate a family's Individual Program Plan (IPP) into Spanish or another common language. At the 18 centers that reported, 5,543 of 12,540 translations (44%) took longer. At South Central Los Angeles Regional Center, 2,730 of 3,393 did (80%). More
-
The gap between Hispanic and white clients opens at age 3, at approval.
Under 3, Hispanic and white children got about the same: $6,890 and $6,708 spent per child. From 3 to 21, Hispanic clients had 37% less approved per person and 26% less spent. All 21 centers approved less per Hispanic client. More
-
Similar rates, 3.5 times the spending.
Westside Regional Center spent $17,897 per client aged 3 to 21. Central Valley Regional Center spent $5,071, though its rates for the same services run only about 2% lower. Westside and South Central Los Angeles pay identical rates, and Westside spent 1.9 times as much per client. More
-
White clients were approved for camp nearly five times as often.
When the state let Regional Centers pay for camp and social recreation again in 2021, it told them to reach communities of color. In 2024-25, 2.3% of white clients aged 3 to 21 had camp approved, against 0.5% of Hispanic clients. More
-
$6.29 billion was approved but never spent.
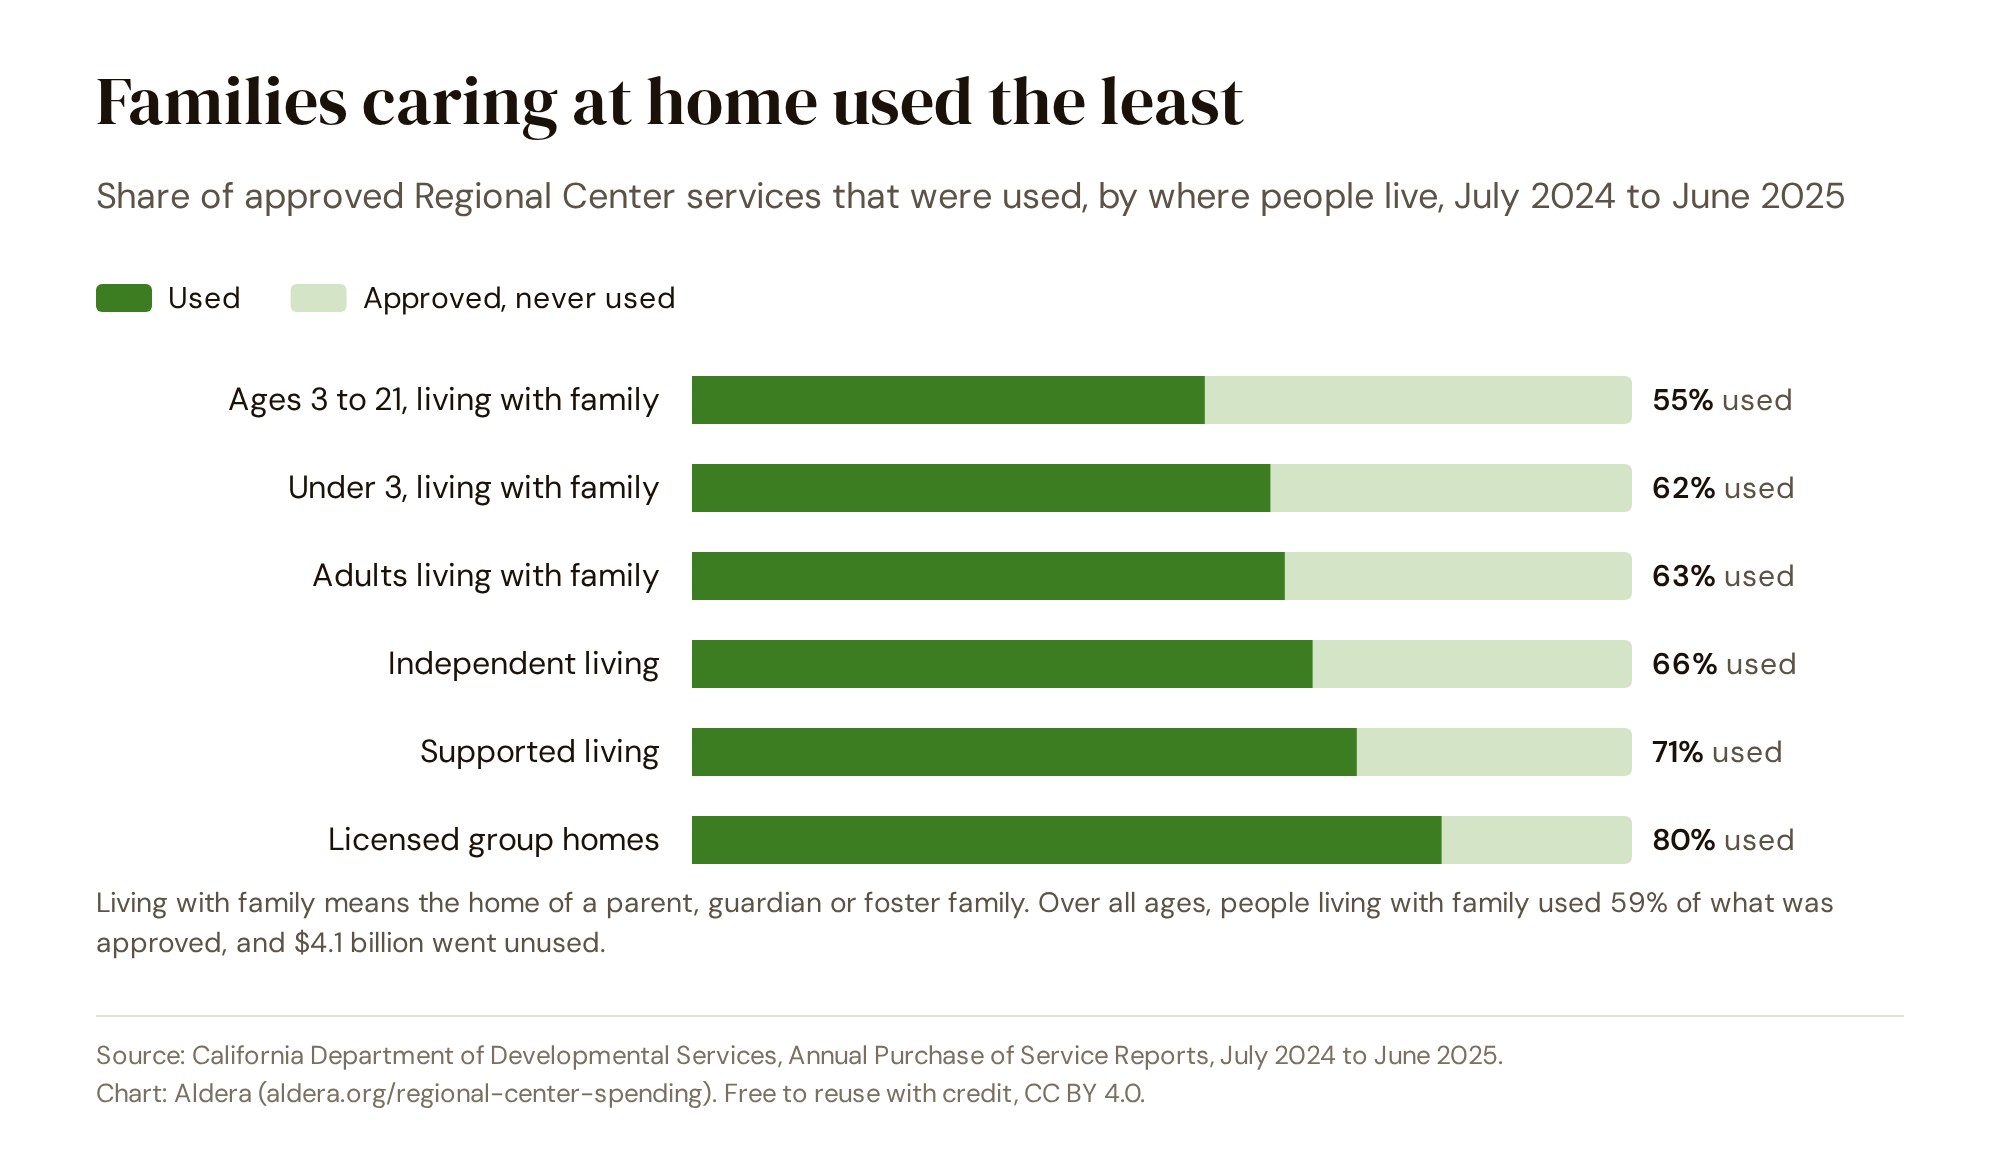
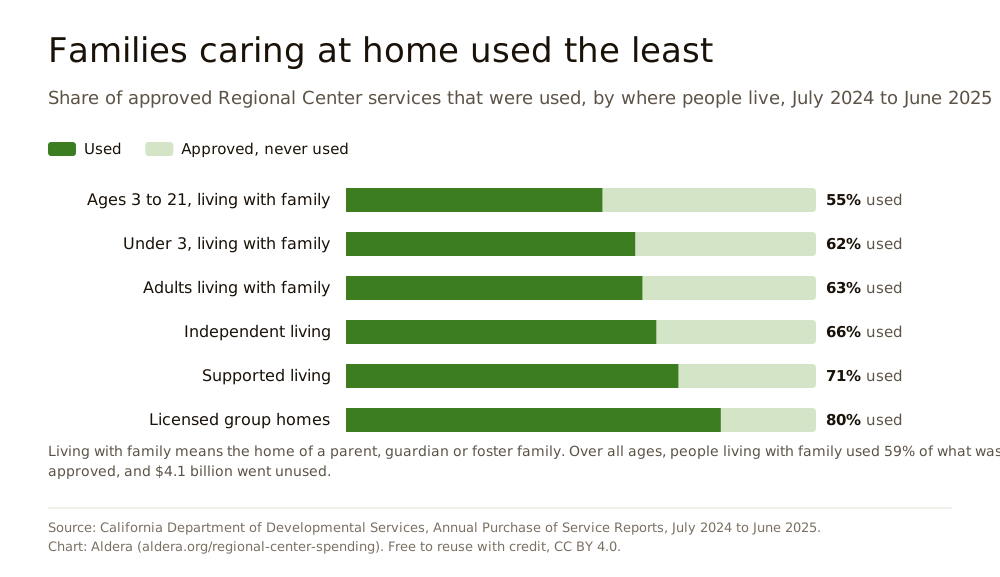
Regional Centers spent 67% of the $19.1 billion they approved. The year before, $4.86 billion went unspent. People living with family used 59% of what was approved for them; people in licensed group homes used 80%. More
-
One in four clients aged 3 to 21 got no paid service all year.
That's 66,618 of 269,992 (24.7%), including 46,402 autistic clients. The share ran from 13% at South Central Los Angeles to 38% at East Bay. More
Late translations of the IPP
The Individual Program Plan, or IPP, is the document that lists every service a Regional Center agrees to pay for. A family can ask for it in its own language. The state gives a Regional Center 45 days for a language spoken by at least 5% of the people receiving its services, like Spanish, and 60 days for any other language.
In 2024-25, 5,543 of the 12,540 translations in a common language (44%) took longer than 45 days, at the 18 Regional Centers that reported figures. Spanish made up 87% of the requests, and 45% of Spanish translations came late.
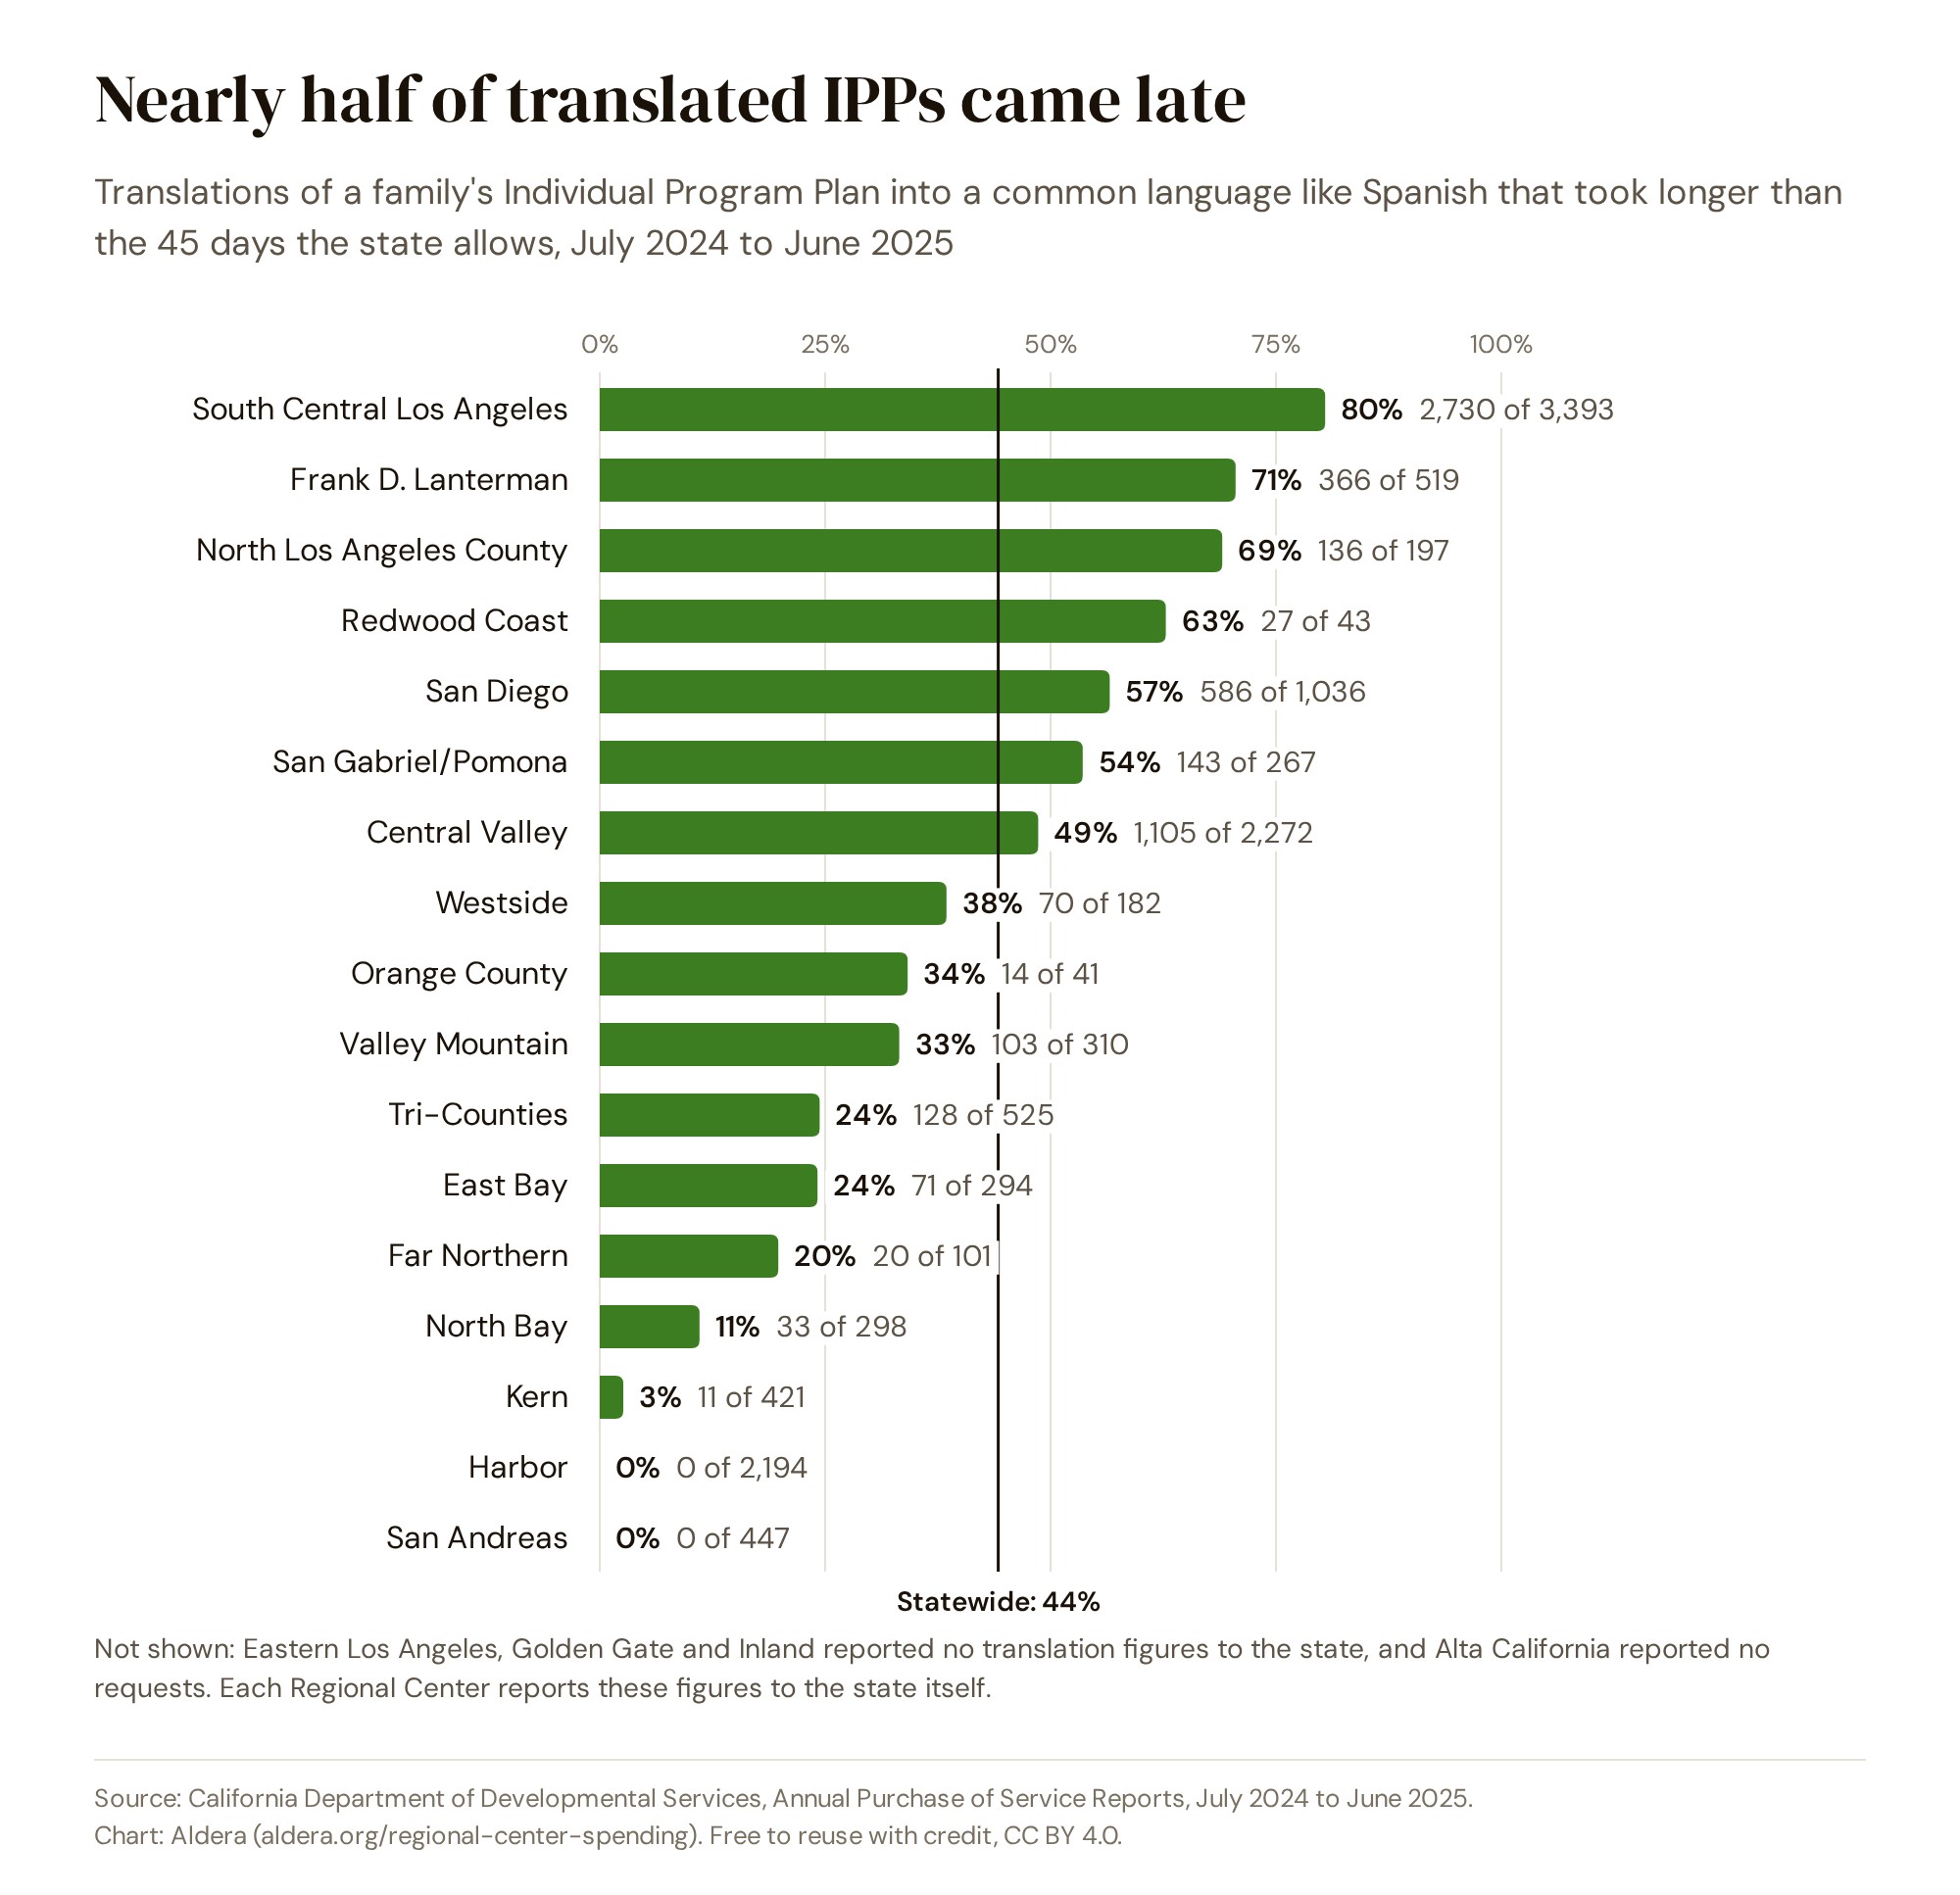
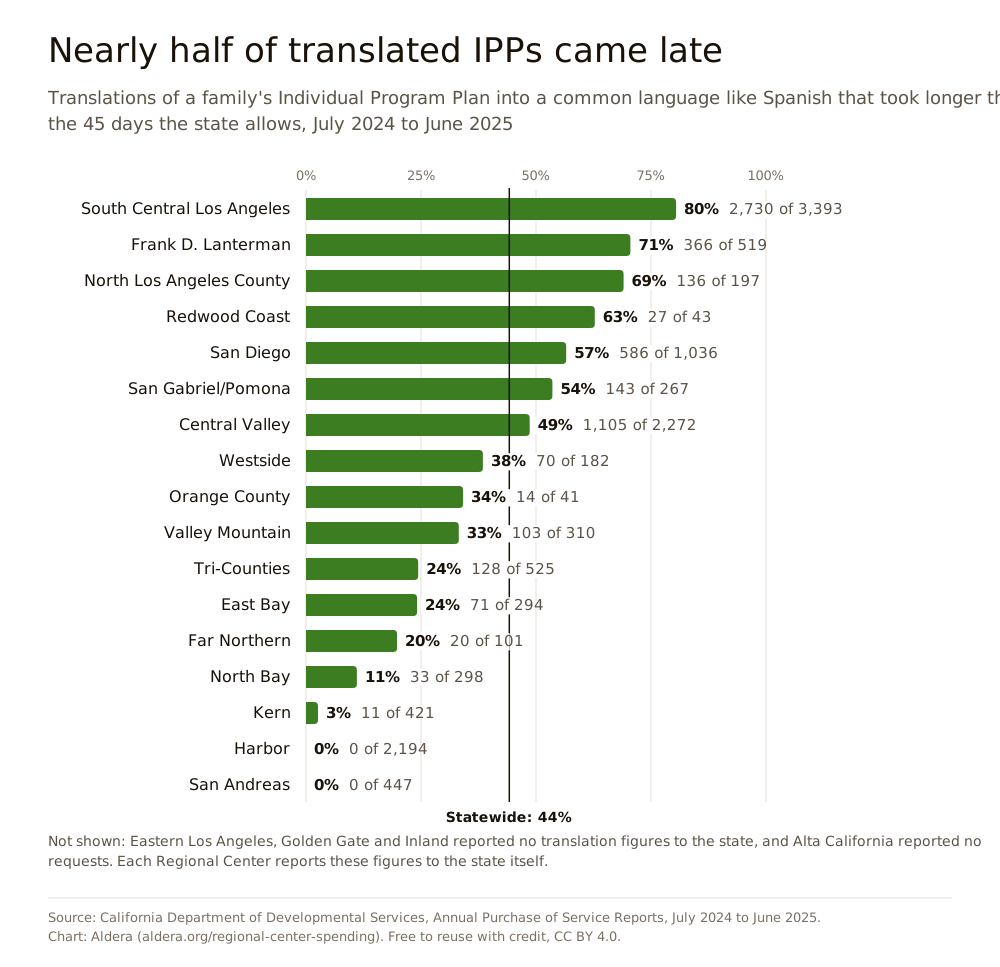
Centers varied widely. South Central Los Angeles finished 80% of its 3,393 translations late, Lanterman 71% and North Los Angeles County 69%. Kern was late on 3%. Harbor reported none late out of 2,194, down from 29% late the year before, and San Andreas reported none late out of 447.
Each Regional Center reports these figures to the state itself. Eastern Los Angeles, Golden Gate and Inland sent no translation figures for 2024-25, and Alta California, which serves 36,660 people, reported no requests at all. Translations into other languages, which get 60 days, came late 37 times out of 233.
The state first published translation timeliness in its 2023-24 reports. That year, 3,333 of 7,756 translations (43%) came late, at the 12 centers that reported.
Who gets less
Regional Centers spend less per person on Hispanic clients than on white clients. The Los Angeles Times reported the gap in 2011, and Public Counsel has tracked it since. Its 2022 report found the gap had widened at 17 of the 21 centers over six years, despite a $66 million state effort to close it. The 2024-25 figures show where the gap starts.
Under age 3, the years of the Early Start program, the two groups are close: $6,890 spent per Hispanic child and $6,708 per white child, with $10,814 and $11,275 approved. From age 3 to 21, Hispanic clients had $14,235 approved per person, against $22,638 for white clients (37% less), and $8,579 spent, against $11,669 (26% less).
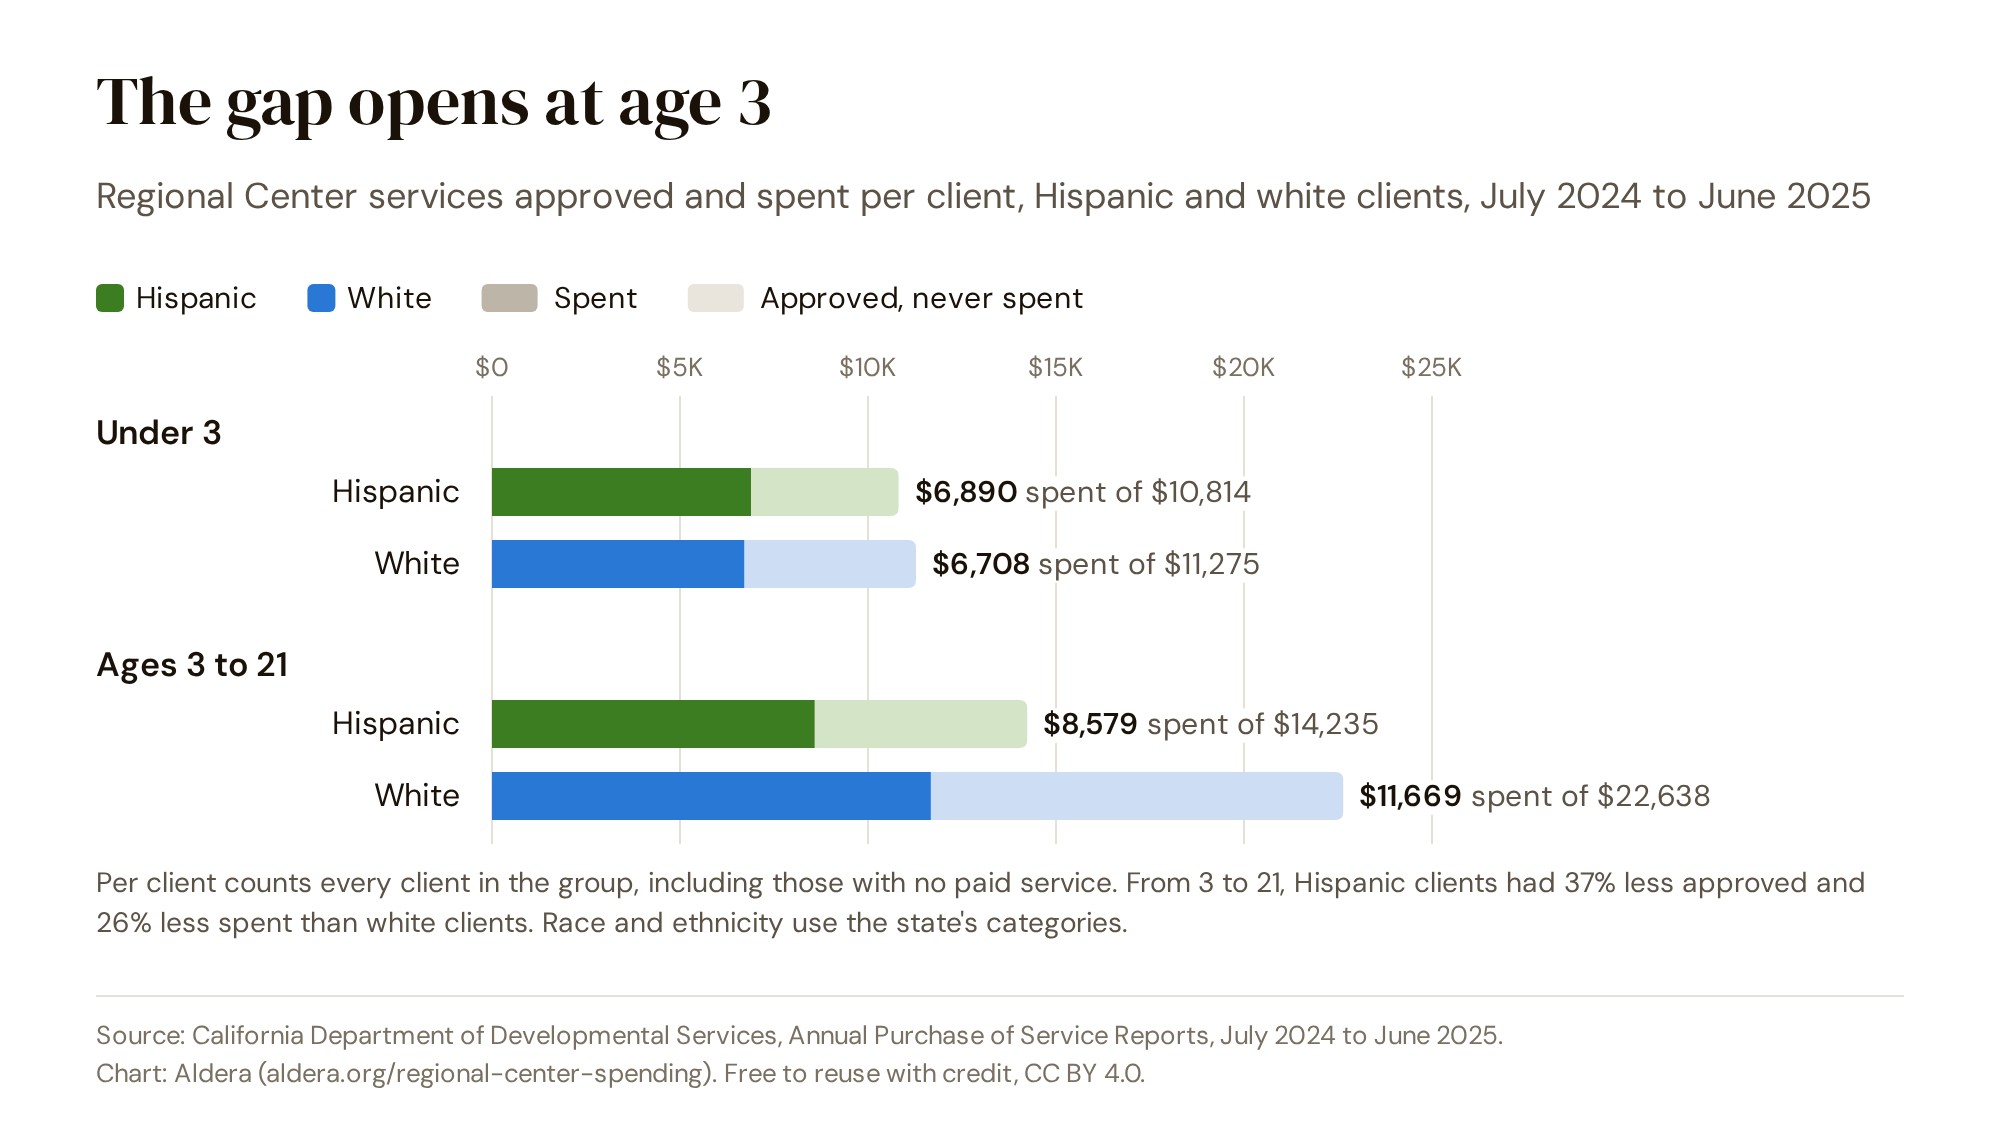
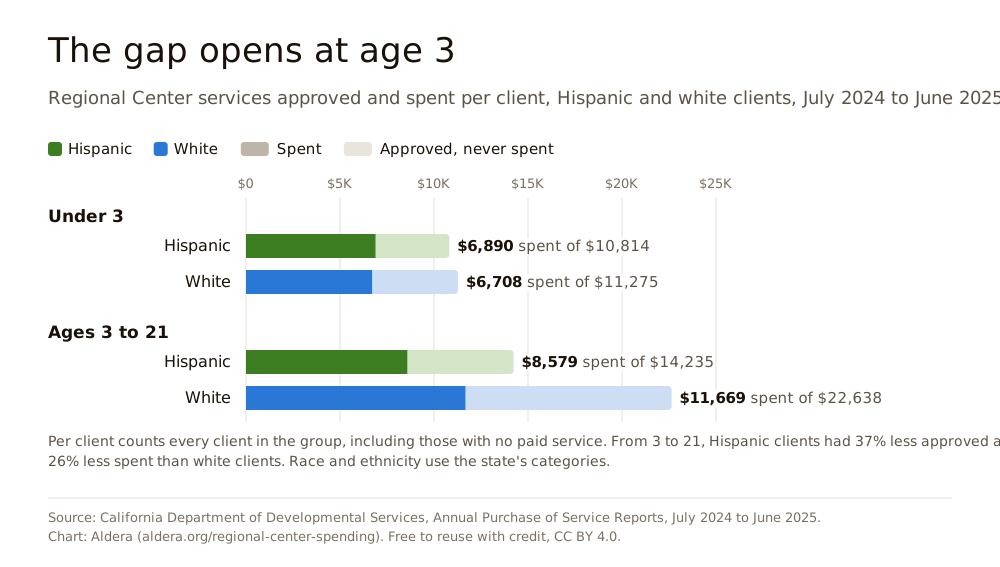
The gap starts with what gets approved, not with what families use. Statewide, Hispanic families used 60.3% of what was approved for them and white families 51.5%, and Hispanic families used the larger share at 14 of the 21 centers. Among clients living with family, Hispanic clients still had 32% less approved ($13,637 against $20,034).
It holds everywhere. All 21 Regional Centers approved less per Hispanic client aged 3 to 21 than per white client, and all 21 spent less. Statewide, a Hispanic client got 74 cents for every dollar spent on a white client. By center, the figure ran from 42 cents at North Bay to 91 cents at Far Northern.
Per client aged 3 to 21, by the state's race and ethnicity categories, July 2024 to June 2025. Two smaller groups are in the download.
| Group | Clients | Approved per client | Spent per client | Share used | No paid service |
|---|---|---|---|---|---|
| Hispanic | 128,912 | $14,235 | $8,579 | 60% | 24% |
| White | 51,420 | $22,638 | $11,669 | 52% | 25% |
| Black or African American | 19,962 | $20,142 | $12,082 | 60% | 25% |
| Asian | 24,873 | $19,601 | $11,245 | 57% | 24% |
| Other race or more than one | 43,194 | $15,540 | $8,231 | 53% | 26% |
By primary language, Spanish-speaking clients aged 3 to 21 had $8,935 spent per person, against $9,701 for English speakers. Fewer of them had no paid service at all: 19%, against 26%.
Camp and social recreation
From July 2009 to June 2021, state law barred Regional Centers, with narrow exceptions, from paying for camp, social recreation and some other services. When the state restored them, it told the centers that their outreach “must consider actions that will increase awareness and facilitate the sharing of information with non-English speaking individuals and communities of color.”
In 2024-25, 2.3% of white clients aged 3 to 21 (1,181 people) had camp approved, against 0.5% of Hispanic clients (617), nearly five times the rate. For social recreation, the rates were 14.3% and 9.6%.
Race and ethnicity follow the state's seven categories, and people with more than one race are counted together as Other Race/Ethnicity or Multi-Cultural. The state changed how Regional Centers record race and language in 2025 and advises comparing these figures with earlier years only with care, so this report doesn't.
Spending by Regional Center
How much a client gets depends heavily on which Regional Center serves them. For clients aged 3 to 21, Westside spent $17,897 per person in 2024-25. Central Valley spent $5,071, and San Diego $5,793. Statewide, the figure was $9,632.
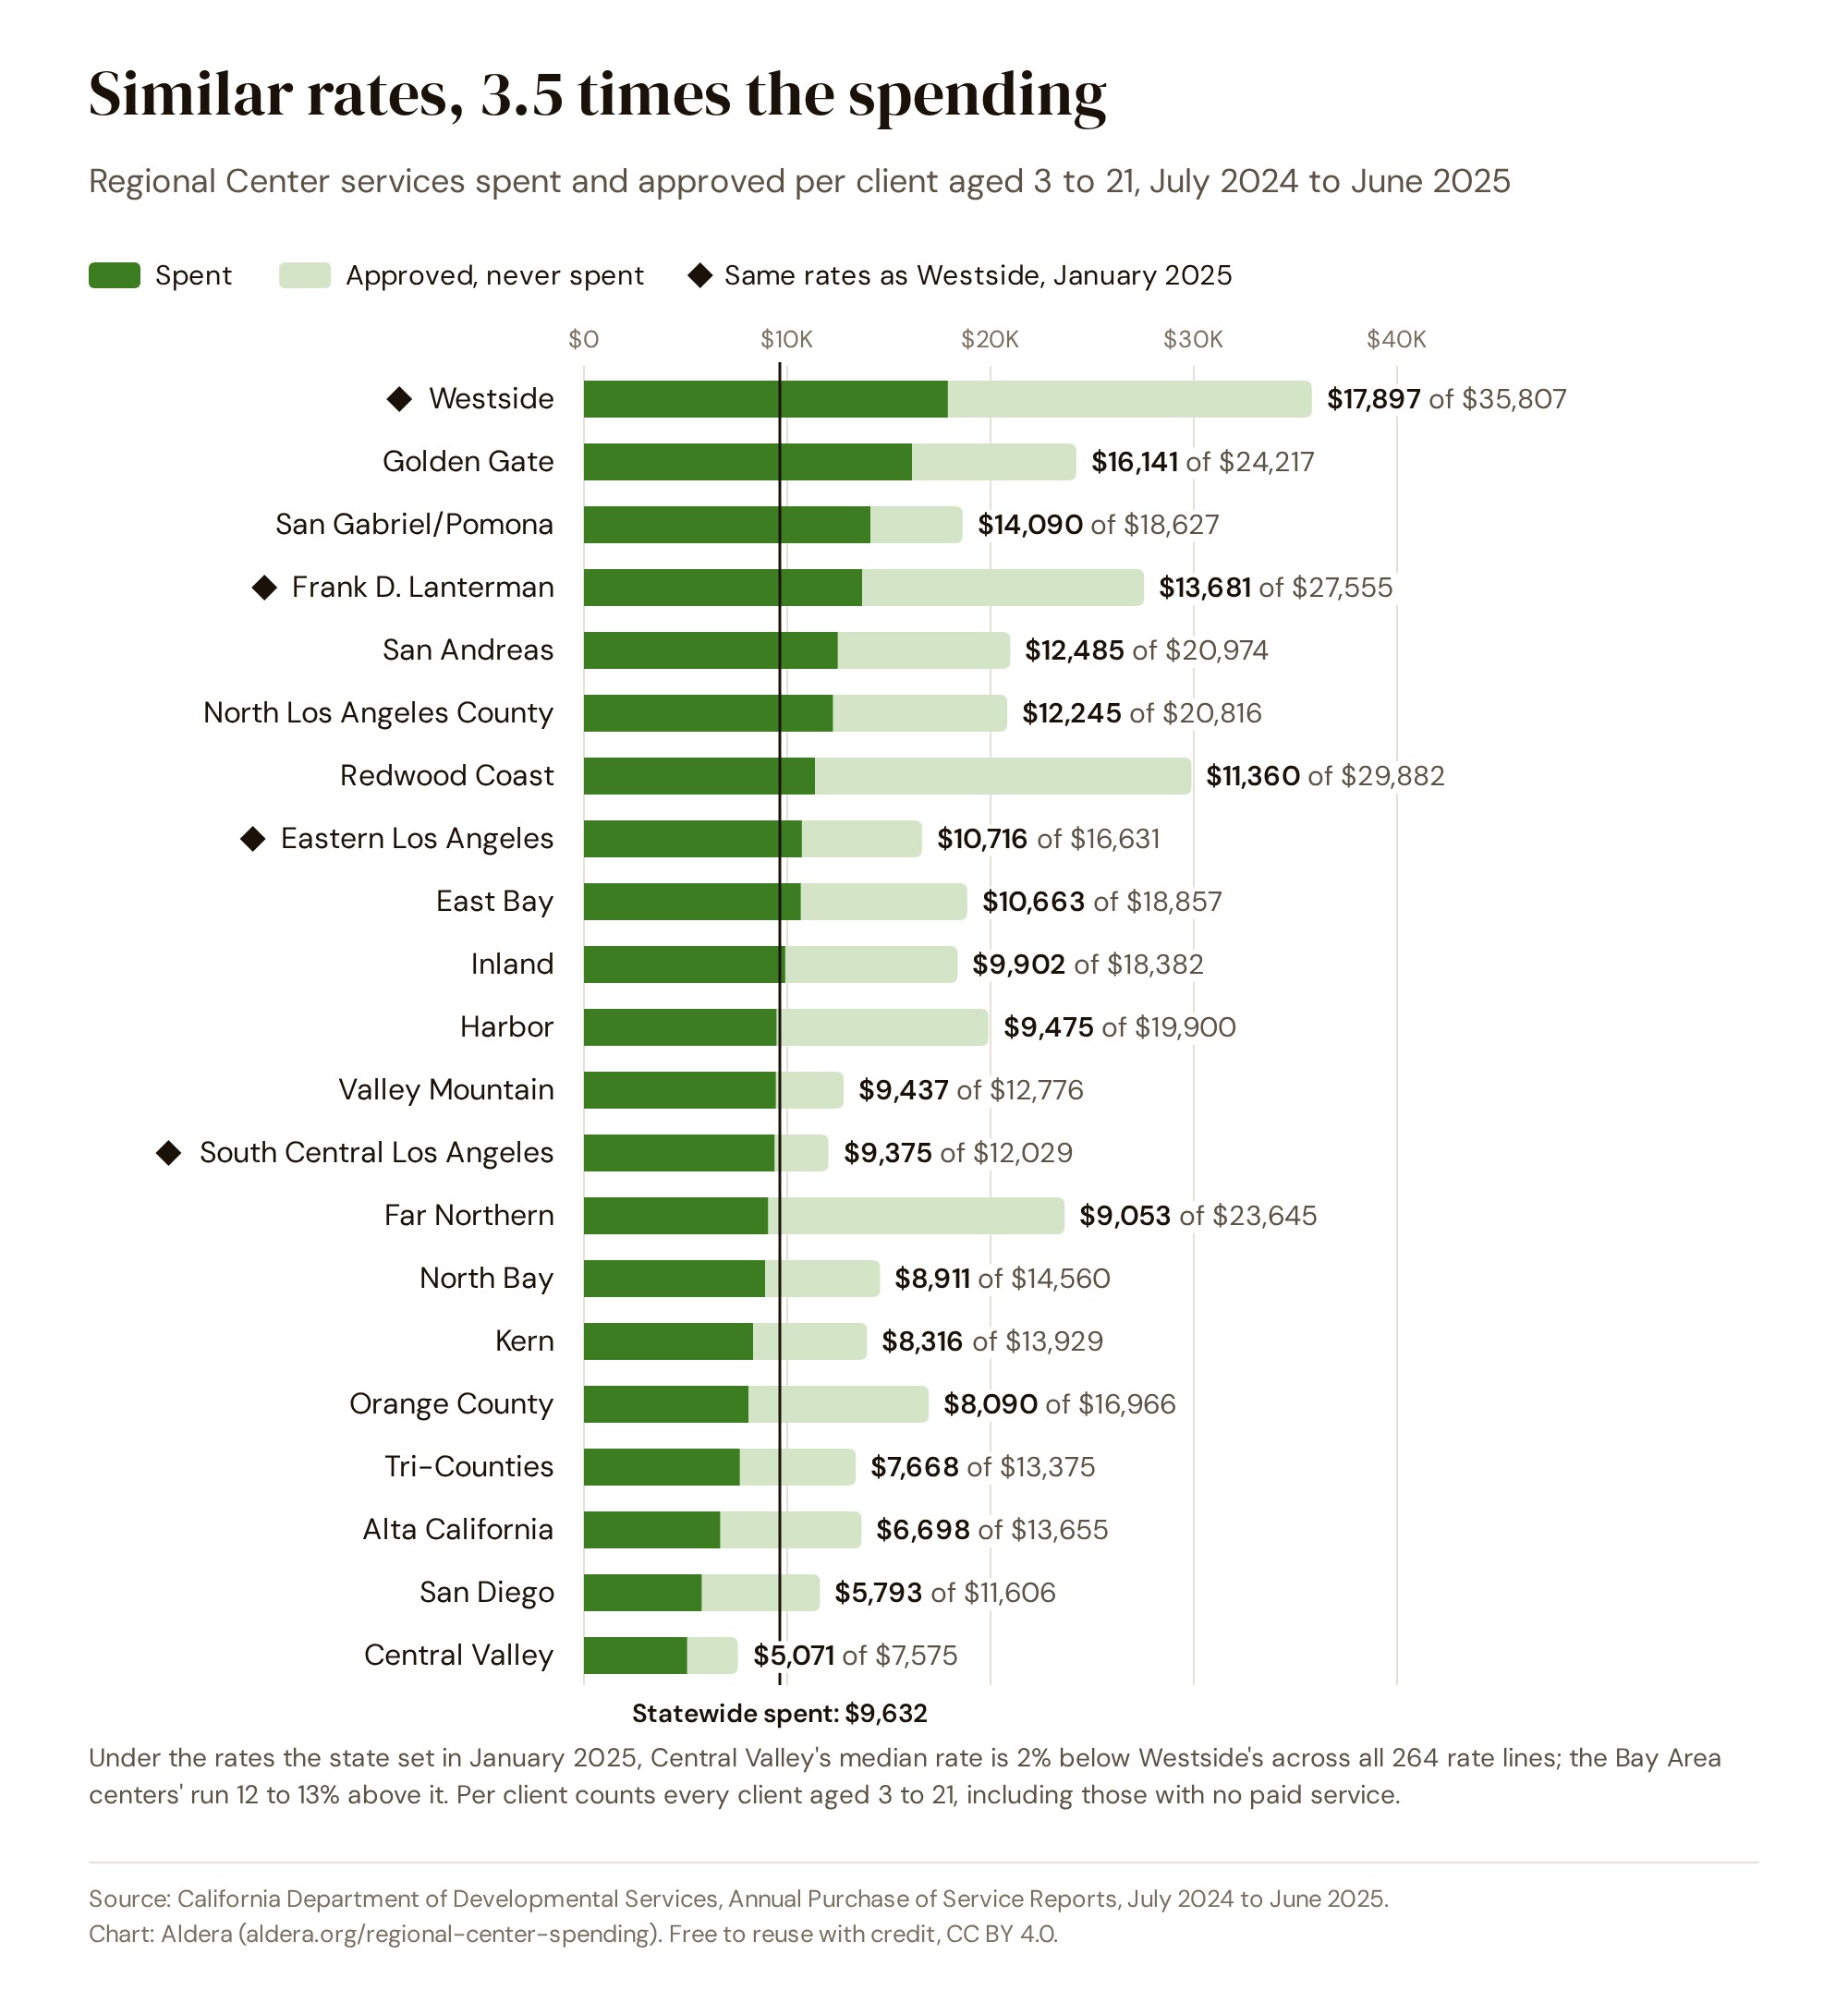
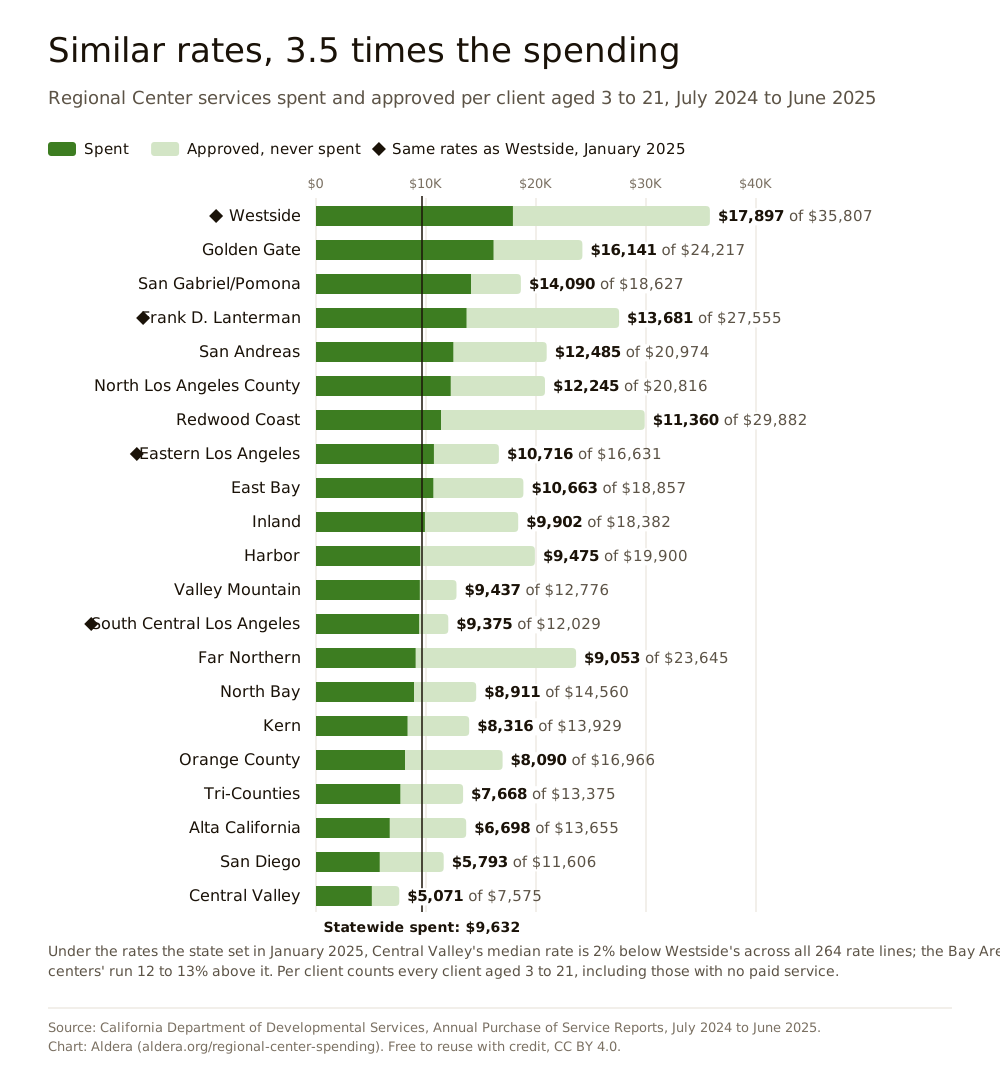
Prices don't explain the difference. The state sets what Regional Centers pay providers for each service, with small adjustments by region. Under the rates that took effect in January 2025, an hour of in-home respite from an agency paid $35.66 at Westside and $35.27 at Central Valley. Across all 264 rate lines, Central Valley's median rate is 2% below Westside's.
Inside Los Angeles County, Westside, Eastern Los Angeles, Lanterman and South Central Los Angeles have identical rates for every service. Their spending per client aged 3 to 21 ran from $9,375 at South Central Los Angeles to $17,897 at Westside, 1.9 times as much. The difference starts with approvals: Westside approved $35,807 per client, and South Central Los Angeles $12,029.
Centers that approve more also leave more unused. Across the 21 centers, the more a center approved per client aged 3 to 21, the smaller the share it spent (correlation −0.49). Westside spent 50% of what it approved, and South Central Los Angeles 78%.
These are raw averages, as the state publishes them. They aren't adjusted for differences in age, diagnosis or living situation between centers.
Approved, never spent
Approval isn't the same as help. In 2024-25, Regional Centers approved $19.06 billion in services and spent $12.77 billion, or 67%. The other $6.29 billion was never used. A year earlier, $4.86 billion went unused. Approvals grew 26% in a year, and the unused amount grew 29%.
The shortfall is widest for people who live with family. They used 59% of what was approved for them, against 80% for people in licensed group homes. Clients aged 3 to 21 living at home used 54.5%, about 55 cents of each approved dollar.
The state's figures can't say why a service went unused. California's State Auditor asked families who use respite, the paid break for caregivers, in a 2022 survey. Nearly 70% of those who hit a barrier named the same top problem: a “lack of available respite workers for the times needed.” The auditor also found that about 21% of families approved for respite used none of it in a typical year.
The Los Angeles Times reported in 2024, using figures from the Association of Regional Center Agencies, that the centers had recently spent roughly two-thirds of what they authorized. Money left unspent goes back to the state: more than $978 million in the budget year that ended in mid-2022.
No paid service all year
66,618 of the 269,992 Regional Center clients aged 3 to 21 (24.7%) had no service paid for by their center during 2024-25, including 46,402 of 173,684 autistic clients (26.7%). A year earlier, the share was 28.6%.
Some of these clients get what they need from school, Medi-Cal or IHSS, and the state's figures can't tell them apart from families waiting for a service to start. The share ran from 13% at South Central Los Angeles to 38% at East Bay.
Every Regional Center at a glance
Clients aged 3 to 21 unless noted, July 2024 to June 2025. Select a column heading to sort. “Hispanic per $1 to white” is spending per Hispanic client for every dollar per white client. Names link to our guide to that center, where we have one.
| Alta California | 36,660 | $13,655 | $6,698 | 49% | 17% | 71¢ | No requests |
| Central Valley | 36,927 | $7,575 | $5,071 | 67% | 25% | 72¢ | 49% |
| East Bay | 30,318 | $18,857 | $10,663 | 57% | 38% | 57¢ | 24% |
| Eastern Los Angeles | 17,908 | $16,631 | $10,716 | 64% | 18% | 89¢ | Not reported |
| Far Northern | 12,281 | $23,645 | $9,053 | 38% | 27% | 91¢ | 20% |
| Frank D. Lanterman | 16,355 | $27,555 | $13,681 | 50% | 22% | 77¢ | 71% |
| Golden Gate | 12,192 | $24,217 | $16,141 | 67% | 30% | 73¢ | Not reported |
| Harbor | 21,871 | $19,900 | $9,475 | 48% | 28% | 78¢ | 0% |
| Inland | 60,024 | $18,382 | $9,902 | 54% | 25% | 86¢ | Not reported |
| Kern | 17,812 | $13,929 | $8,316 | 60% | 25% | 63¢ | 3% |
| North Bay | 13,690 | $14,560 | $8,911 | 61% | 23% | 42¢ | 11% |
| North Los Angeles County | 44,191 | $20,816 | $12,245 | 59% | 33% | 60¢ | 69% |
| Orange County | 30,480 | $16,966 | $8,090 | 48% | 27% | 58¢ | 34% |
| Redwood Coast | 6,056 | $29,882 | $11,360 | 38% | 16% | 87¢ | 63% |
| San Andreas | 24,639 | $20,974 | $12,485 | 60% | 21% | 48¢ | 0% |
| San Diego | 49,496 | $11,606 | $5,793 | 50% | 31% | 61¢ | 57% |
| San Gabriel/Pomona | 19,022 | $18,627 | $14,090 | 76% | 25% | 58¢ | 54% |
| South Central Los Angeles | 30,767 | $12,029 | $9,375 | 78% | 13% | 75¢ | 80% |
| Tri-Counties | 24,979 | $13,375 | $7,668 | 57% | 20% | 85¢ | 24% |
| Valley Mountain | 25,875 | $12,776 | $9,437 | 74% | 20% | 81¢ | 33% |
| Westside | 14,238 | $35,807 | $17,897 | 50% | 22% | 67¢ | 38% |
| Statewide | 540,868 | $17,013 | $9,632 | 57% | 25% | 74¢ | 44% |
Questions about the data
How much do California's Regional Centers spend?
In the year from July 2024 to June 2025, the 21 Regional Centers approved $19.06 billion in services for 540,868 people and spent $12.77 billion, according to the state's Annual Purchase of Service Reports.
What share of approved Regional Center services gets used?
67% statewide in 2024-25. People living with family used 59% of what was approved for them, and clients aged 3 to 21 living at home 54.5%.
How long does a Regional Center have to translate an IPP?
45 days for a language spoken by at least 5% of the people receiving its services, such as Spanish, and 60 days for other languages, according to the Department of Developmental Services. In 2024-25, 44% of translations in a common language took longer than 45 days at the centers that reported.
Do Regional Centers spend less on Hispanic clients?
Yes, from age 3. Hispanic clients aged 3 to 21 had $8,579 spent per person in 2024-25, against $11,669 for white clients, and 37% less approved. All 21 centers spent less per Hispanic client. Under age 3 there's no such gap.
Where does the data come from?
The California Department of Developmental Services publishes Annual Purchase of Service Reports for every Regional Center by December 31 each year. This report uses the machine-readable files for 2024-25, published in December 2025.
How we did it
- Source
- The California Department of Developmental Services' Annual Purchase of Service Reports for fiscal year 2024-25 (July 1, 2024 to June 30, 2025), published in December 2025 under Welfare and Institutions Code section 4519.5. We used the machine-readable files for all 21 Regional Centers and the statewide file, plus the 2023-24 files for year-over-year totals.
- Who's counted
- Everyone with an active Regional Center status in January 2025, or with at least one purchase of service record during the year: 540,868 people. Ages are as of December 31, 2024. Someone who moved between centers can be counted by both.
- Approved, spent, used
- “Approved” is the state's total authorized services. “Spent” is total expenditures, the claims paid. “Share used” is spent divided by approved. Per-client figures divide by every client in a group, including those with nothing spent, as the state does.
- No paid service
- Clients with no purchase of service claims in the year, or only zero or negative ones.
- Translations
- Each Regional Center reports its IPP translation requests, and the dates it received and sent them, to the state. A request in a language spoken by at least 5% of the people receiving services must be completed in 45 days, and other languages in 60. Figures are for the 45-day group unless we say otherwise.
- Camp and social recreation
- Clients aged 3 to 21 with any camping or social recreation record in the state's files (approved, paid or both), divided by all clients aged 3 to 21 in the same group.
- Rates
- Each center's rate file from the state, effective January 1, 2025 (version of February 13, 2025), compared with Westside's line by line: 264 lines per center. Rates in the first half of the fiscal year were still being phased in, so the comparison describes the rates in effect from January 2025.
- Privacy
- The state hides small counts to protect privacy. Where a count is hidden, we used the totals and shares the state still publishes.
- Limits
- Figures aren't adjusted for age, diagnosis or living situation beyond what's shown. We don't compare race or language with earlier years. Shares are rounded half up from exact figures.
- Reproducible
- A script computes every figure on this page from the state's files. Write to team@aldera.org for the code.
Data and charts
Free to use under Creative Commons Attribution 4.0 (CC BY 4.0). Please credit “Aldera analysis of California Department of Developmental Services data” and link to this page. The state's own reports are public.
- Every Regional Center, 2024-25One row per center plus the statewide row, 29 columns. regional-center-spending-2024-25.csvCSV, 5 KB
- Statewide breakdowns, 2024-25By age group, race and ethnicity, primary language, living situation and diagnosis. regional-center-spending-2024-25-statewide.csvCSV, 10 KB
Charts
Each chart comes as an SVG, which stays sharp at any size, and as a 2,000-pixel JPEG.
- Nearly half of translated IPPs came late SVGJPEG, 2,000 pixels wideSee it on this page
- The gap opens at age 3 SVGJPEG, 2,000 pixels wideSee it on this page
- Similar rates, 3.5 times the spending SVGJPEG, 2,000 pixels wideSee it on this page
- Families caring at home used the least SVGJPEG, 2,000 pixels wideSee it on this page
What each column means
- regional_center
- The Regional Center's name.
- code
- The state's short code for the center.
- clients_all_ages
- Clients of all ages.
- approved_all_ages_usd
- Services approved for clients of all ages, in dollars.
- spent_all_ages_usd
- Services paid for clients of all ages, in dollars.
- clients_3_21
- Clients aged 3 to 21 on December 31, 2024.
- approved_3_21_usd
- Services approved for clients aged 3 to 21, in dollars.
- spent_3_21_usd
- Services paid for clients aged 3 to 21, in dollars.
- approved_per_client_3_21_usd
- Approved dollars divided by every client aged 3 to 21.
- spent_per_client_3_21_usd
- Spent dollars divided by every client aged 3 to 21.
- share_used_3_21
- Spent divided by approved, ages 3 to 21.
- no_paid_service_3_21
- Clients aged 3 to 21 with no paid service in the year.
- share_no_paid_service_3_21
- The same, as a share of clients aged 3 to 21.
- autistic_clients_3_21
- Clients aged 3 to 21 with autism, as the state records it.
- autistic_no_paid_service_3_21
- Autistic clients aged 3 to 21 with no paid service in the year.
- hispanic_clients_3_21
- Hispanic clients aged 3 to 21 (blank where the state hides it).
- hispanic_approved_per_client_3_21_usd
- Approved dollars per Hispanic client aged 3 to 21.
- hispanic_spent_per_client_3_21_usd
- Spent dollars per Hispanic client aged 3 to 21.
- hispanic_share_used_3_21
- Spent divided by approved, Hispanic clients aged 3 to 21.
- white_clients_3_21
- White clients aged 3 to 21 (blank where the state hides it).
- white_approved_per_client_3_21_usd
- Approved dollars per white client aged 3 to 21.
- white_spent_per_client_3_21_usd
- Spent dollars per white client aged 3 to 21.
- white_share_used_3_21
- Spent divided by approved, white clients aged 3 to 21.
- hispanic_to_white_spent_per_client_3_21
- Spent per Hispanic client divided by spent per white client.
- ipp_translation_requests_45_day
- IPP translations requested in a language with a 45-day limit, completed in the year.
- ipp_translations_late_45_day
- Of those, translations not completed within 45 days.
- share_ipp_translations_late_45_day
- Late translations as a share of requests.
- ipp_translation_data
- Reported, no requests, or not reported to the state.
- median_rate_vs_westside_jan_2025
- The center's median rate divided by Westside's, across every rate line, January 2025.
The state's own files: Annual Purchase of Service Reports, Department of Developmental Services.
How to cite this report
Full citation
Levi, N. (2026). California Regional Center Spending Report: 2024-25 data. Aldera. https://aldera.org/regional-center-spending
Credit line for a chart or story
Source: Aldera analysis of California Department of Developmental Services data
About this report
Nathaniel Levi founded Aldera, a Los Angeles provider of adaptive skills training for people with developmental disabilities. Regional Centers pay for that training, including North Los Angeles County, Westside and Eastern Los Angeles Regional Centers. This report uses only public state data, and no Regional Center saw it before it was published.
We update it each year after the state posts new figures, which it must do by December 31. The next edition, with July 2025 to June 2026 data, is planned for January 2027.
Questions, corrections and requests for comment: team@aldera.org
Updates
- October 23, 2026First edition, with 2024-25 data.
Sources
- California Department of Developmental Services. Annual Purchase of Service Reports, FY 2024-25 and FY 2023-24.
- Department of Developmental Services. Annual POS Reports: Methodology Overview, FY 2024/25 (December 30, 2025).
- Department of Developmental Services. Annual POS Reports: Frequently Asked Questions, FY 2024/25 (December 30, 2025).
- Department of Developmental Services. Rate models by Regional Center, effective January 1, 2025 (updated February 13, 2025).
- Department of Developmental Services. Restoration of Camping, Social Recreation and Other Services (October 7, 2021).
- California State Auditor. In-Home Respite Services, report 2021-120 (2022).
- Public Counsel. Report finds California has failed in effort to reduce racial disparities in services for children with developmental disabilities (May 26, 2022).
- Los Angeles Times, via Disability Scoop. Nearly $1 billion in funds for disability services left unspent (August 22, 2024).
- California Healthline. Hearing examines unequal state spending on autism services, on the Los Angeles Times' 2011 series (2012).